Physicochemical and biological characteristics of surface and groundwater in Uhonmora-Ora were undertaken. Physicochemical parameters examined include pH, turbidity, dissolved oxygen, total dissolved solids, total suspended solids, and electrical conductivity. The heavy metals studied were Iron, Cadmium, Calcium, Copper, Magnesium, Lead, and Zinc. The bacteriological parameters were counts for pneumoniae, coli, typhi, and aerogenes. The study objective assessed the chemical and biological characteristics of surface and groundwater in Uhonmora-Ora and ascertained its suitability. Data from sixty surface and groundwater samples from streams/rivers and hand-dug wells were analyzed. Primary data from 30 water samples of “A” surface and “B” groundwater samples from hand-dug wells were obtained and analysed from the field of study. The technique of study was purely experimental. The study was conducted during the dry season and water samples collections from the 2 sources were analysed in the laboratory to ascertain their state of water quality of physicochemical parameters and biological counts in comparison with the recommended standards of WHO (2015) and NSDWQ (2007), in line with the Nigeria Ministry of Environment standards (2018), on water quality for drinking desire uses. Results showed that a combination of very high and positive correlations exists between and among the tested parameters. However, variations exist within and among the mean concentrations of NTU, DO, TSS, TDS, Fe, Cd, Cu, Ca, Mg, Pb, Zn, K, E, S, and Ea parameters in surface and groundwater sources. The study recommends that at regular intervals, samples from these water sources should be assessed against water quality standards.
| Published in | American Journal of Environmental Science and Engineering (Volume 10, Issue 1) |
| DOI | 10.11648/j.ajese.20261001.12 |
| Page(s) | 21-36 |
| Creative Commons |
This is an Open Access article, distributed under the terms of the Creative Commons Attribution 4.0 International License (http://creativecommons.org/licenses/by/4.0/), which permits unrestricted use, distribution and reproduction in any medium or format, provided the original work is properly cited. |
| Copyright |
Copyright © The Author(s), 2026. Published by Science Publishing Group |
Geochemistry, Biology, Heavy Metals, Surface and Groundwater Sources, Wet-season
S/N | Quarter and Sampling Code | Wet Season (September) 2024 |
|---|---|---|
1 | Odosi (ODO) | a. Hand-Dug Well: ODO-GW2/001A, ODO-GW2/002A, ODO-GW2/003A and ODO-GW2/004A only |
2 | Ukpafoga (UKP) | a. Hand-Dug Well: UKP-GW2/001A, UKP-GW2/002A, UKP-GW2/003A and UKP-GW2/004A. b. Surface Water: UKP-SU2/001B, UKP-SU2/002B, UKP-SU2/003B, and UKP-SU2/004B. |
3 | Ukhuedeodu (ODU) | a. Hand-Dug Well: ODU-GW2/001A, ODU-GW2/002A, ODU-GW2/003A, and ODU-GW2/004A. b. Surface Water: ODU-SU2/001B, ODU-SU2/002B, ODU-SU2/003B, and ODU-SU2/004B. |
4 | Ukpafisi (UFI) | a. Hand-Dug Well: UFI-GW2/001A, UFI-GW2/002A, UFI-GW2/003A, and UFI-GW2/004A. b. Surface Water: UFI-SU2/001B, UFI-SU2/002B, UFI-SU2/003B, and UFI-SU2/004B. |
5 | Ukpokunmu (UMU) | a. Hand-Dug Well: UMU-GW2/001A, UMU-GW2/002A, UMU-GW2/003A, UMU-GW2/004A, UMU-GW2/005B, and UMU-GW2/006B. b. Surface Water: UMU-SU2/001B, UMU-SU2/002B, UMU-SU2/003B, UMU-SU2/004B, UMUSU2/005B, and UMU-SU2/006B. |
6 | Ukpafekhai (UAI) | a. Hand-Dug Well: UAI-GW2/001A, UAI-GW2/002A, UAI-GW2/003A, and UAI-GW2/004A. b. Surface Water: UAI-GW2/001B, UAI-GW2/002B, UAI-GW2/003B, and UAI-SU2/004B. |
7 | Ukpafortisi (USI) | a. Hand-Dug Well: USI-GW2/001A, USI-GW2/002A, USI-GW2/003A, USI-GW2/004A. b. Surface Water: USI-SU2/001B, USI-SU2/002B, USI-SU2/003B, and USI-SU2/004B. |
8 | Ukhuoro (URO) | a. Hand-Dug Well: URO-GW2/001A, URO-GW2/002A, URO-GW2/003A, and UROGW2/004A only. |
Variable | SU Temp | GW Temp | SU NTU | GW NTU | SU DO | GW DO | SU TSS | GW TSS | SU PH | GW PH | SU EC | GW EC | SU TDS | GW TDS |
|---|---|---|---|---|---|---|---|---|---|---|---|---|---|---|
WHO 2018 | 36.1°C | 36.1°C | 5.0 | 5.0 | 3.0 | 3.0 | 200 | 200 | 8.5 | 8.5 | 1000 | 1000 | 500 | 500 |
001 | 25.5 | 28.4 | 11.46 | 48.69 | 3.99 | 4.08 | 25.0 | 35.0 | 6.5 | 4.8 | 0.03 | 0.18 | 32 | 136 |
002 | 25.4 | 28.9 | 10.02 | 103.10 | 3.93 | 4.17 | 24.0 | 40.6 | 6.4 | 4.9 | 0.03 | 0.40 | 28 | 288 |
003 | 25.4 | 28.7 | 9.67 | 122.08 | 3.99 | 345.51 | 26.1 | 53.6 | 6.5 | 4.6 | 0.03 | 0.48 | 27 | 341 |
004 | 25.4 | 28.5 | 10.02 | 112.05 | 3.93 | 5.28 | 22.4 | 43.5 | 6.4 | 6.2 | 0.03 | 0.44 | 28 | 313 |
005 | 25.7 | 29.2 | 8.95 | 112.41 | 3.81 | 4.34 | 30.3 | 45.7 | 6.2 | 5.1 | 0.02 | 0.44 | 25 | 314 |
006 | 28.7 | 28.7 | 8.95 | 80.19 | 3.93 | 4.26 | 24.7 | 43.7 | 6.4 | 5.0 | 0.02 | 0.31 | 25 | 224 |
007 | 25.8 | 29.4 | 8.95 | 106.68 | 3.93 | 5.02 | 24.0 | 61.7 | 6.4 | 5.9 | 0.02 | 0.42 | 25 | 298 |
008 | 26.4 | 29.4 | 8.95 | 124.58 | 3.93 | 4.51 | 26.8 | 63.5 | 6.4 | 5.3 | 0.02 | 0.49 | 25 | 348 |
009 | 27.2 | 29.8 | 8.95 | 346.54 | 4.11 | 5.53 | 30.0 | 35.7 | 6.7 | 6.5 | 0.02 | 1.34 | 25 | 968 |
010 | 26.9 | 29.7 | 8.95 | 161.82 | 3.93 | 5.79 | 30.2 | 36.3 | 6.4 | 6.8 | 0.02 | 0.63 | 25 | 452 |
011 | 26.6 | 28.1 | 9.31 | 155.01 | 3.93 | 5.19 | 24.6 | 35.0 | 6.4 | 6.1 | 0.02 | 0.61 | 26 | 433 |
012 | 26.6 | 28.4 | 9.31 | 201.55 | 3.93 | 5.79 | 25.8 | 40.6 | 6.4 | 6.8 | 0.02 | 0.78 | 26 | 563 |
013 | 26.1 | 28.2 | 10.74 | 191.17 | 4.18 | 5.19 | 32.0 | 53.6 | 6.8 | 6.1 | 0.03 | 0.75 | 30 | 534 |
014 | 25.8 | 28.9 | 10.74 | 181.51 | 4.11 | 5.28 | 32.8 | 43.5 | 6.7 | 6.2 | 0.03 | 0.71 | 30 | 507 |
015 | 25.8 | 29.1 | 10.74 | 228.05 | 4.05 | 5.45 | 24.2 | 45.7 | 6.6 | 6.4 | 0.03 | 0.89 | 30 | 637 |
016 | 26.9 | 27.6 | 11.10 | 174.35 | 3.99 | 5.36 | 25.8 | 43.7 | 6.5 | 6.3 | 0.03 | 0.68 | 31 | 487 |
017 | 27 | 29.2 | 19.69 | 148.93 | 4.42 | 5.28 | 25.0 | 61.7 | 7.2 | 6.2 | 0.07 | 0.58 | 55 | 416 |
018 | 26.7 | 28.5 | 17.18 | 110.26 | 4.18 | 5.36 | 24.0 | 63.5 | 6.8 | 6.3 | 0.05 | 0.43 | 48 | 308 |
019 | 26.2 | 29.2 | 16.83 | 75.54 | 4.18 | 4.68 | 26.1 | 35.7 | 6.8 | 5.5 | 0.06 | 0.29 | 47 | 211 |
020 | 26.6 | 29.2 | 16.83 | 91.29 | 4.18 | 4.51 | 22.4 | 36.3 | 6.8 | 5.3 | 0.05 | 0.34 | 47 | 255 |
021 | 26.4 | 28.7 | 14.68 | 134.25 | 3.99 | 4.34 | 30.3 | 35.0 | 6.5 | 5.1 | 0.04 | 0.52 | 41 | 375 |
022 | 26.3 | 29.4 | 14.32 | 18.62 | 3.99 | 4.34 | 24.7 | 54.3 | 6.5 | 5.10 | 0.04 | 0.1 | 40 | 52 |
023 | 26.1 | 29.4 | 13.60 | 89.50 | 4.05 | 5.19 | 24.0 | 54.3 | 6.6 | 6.1 | 0.04 | 0.35 | 38 | 250 |
024 | 26.1 | 29.8 | 13.60 | 167.54 | 3.99 | 5.19 | 25.0 | 54.2 | 6.5 | 6.1 | 0.04 | 0.65 | 38 | 468 |
025 | 25.8 | 29.7 | 7.52 | 33.29 | 4.11 | 4.60 | 24.0 | 45.6 | 6.7 | 5.4 | 0.02 | 0.12 | 21 | 93 |
026 | - | 28.1 | - | 265.28 | - | 5.62 | - | 43.2 | - | 6.6 | - | 1.03 | - | 741 |
027 | - | 28.4 | - | 334.01 | - | 5.28 | - | 45.3 | - | 6.2 | - | 1.29 | - | 933 |
028 | - | 28.2 | - | 181.86 | - | 5.28 | - | 43.6 | - | 6.2 | - | 0.71 | - | 508 |
029 | - | 28.9 | - | 120.65 | - | 5.11 | - | 42.7 | - | 6.0 | - | 0.47 | - | 337 |
030 | - | 28.5 | - | 126.73 | - | 5.36 | - | 38.9 | - | 6.3 | - | 0.49 | - | 354 |
031 | - | 29.2 | - | 160.38 | - | 6.13 | - | 40.7 | - | 7.2 | - | 0.60 | - | 448 |
032 | - | 29.1 | - | 93.44 | - | 4.85 | - | 43.5 | - | 5.7 | - | 0.36 | - | 261 |
033 | - | 29.2 | - | 209.79 | - | 5.45 | - | 45.6 | - | 6.4 | - | 0.82 | - | 586 |
034 | - | 28.9 | - | 224.11 | - | 5.36 | - | 46.2 | - | 6.3 | - | 0.87 | - | 626 |
035 | - | 29 | - | 148.69 | - | 4.08 | - | 45.8 | - | 6.8 | - | 0.58 | - | 536 |
Variable | SU Iron (Fe) | GW Iron (Fe) | SU Cad. (Cd) | GW Cad. (Cd) | SU Cop. (Cu) | GW Cop. (Cu) | SU Cal. (Ca) | GW Cal. (Ca) | SU Mag (Ma) | GW Mag (Ma) | SU Lead (Ph) | GW Lead (Pb) | SU Zine (Zn) | GW Zine (Zn |
|---|---|---|---|---|---|---|---|---|---|---|---|---|---|---|
WHO 2018 | 0.1 | 0.1 | 0.003 | 0.003 | 3.0 (2mg/L) | 3.0 (2mg/L) | 75 | 75 | 100–300 mg/litre, | 100–300 mg/litre, | 0.01 | 0.01 | 5.0 | 5.0 |
001 | 0.058 | 0.536 | 0.004 | 0 | 0 | 0.012 | 3.176 | 38.5 | 6.3776 | 0.813 | 0.05 | 0.01 | 0.46 | 0.4599 |
002 | 0.355 | 0.187 | 0.003 | 0 | 0.018 | 0 | 14.105 | 58.6 | 12.0407 | 0.6984 | 0.05 | 0.01 | 0.4677 | 0.4625 |
003 | 0.14 | 0.021 | 0.003 | 0 | 0 | 0.033 | 4.974 | 5.207 | 4.36 | 0.7021 | 0.03 | 0.02 | 0.4699 | 0.4596 |
004 | 0.048 | 0.564 | 0.003 | 0 | 0.057 | 0 | 6.707 | 5.015 | 15.9744 | 13.7454 | 0.03 | 0.04 | 0.4824 | 0.4873 |
005 | 0.156 | 0.265 | 0.004 | 0 | 0.038 | 0 | 4.864 | 4.735 | 18.3124 | 13.2272 | 0.01 | 0.04 | 0.4608 | 0.4627 |
006 | 0.198 | 0.313 | 0.004 | 0 | 0 | 0.024 | 5.012 | 43.9 | 0.5945 | 8.3672 | 0.02 | 0.05 | 0.4666 | 0.4649 |
007 | 0.145 | 0.313 | 0.004 | 0 | 0.01 | 0.005 | 39.1 | 4.82 | 14.971 | 4.747 | 0.02 | 0.04 | 0.4631 | 0.467 |
008 | 0 | 0.206 | 0.004 | 0 | 0 | 0.028 | 25.2 | 21.4 | 23.2766 | 9.1902 | 0.02 | 0.04 | 0.454 | 0.4613 |
009 | 0 | 0.156 | 0.007 | 0 | 0 | 0 | 23.2 | 5.124 | 0.5757 | 2.1966 | 0.02 | 0.03 | 0.461 | 0.4648 |
010 | 0.123 | 0.2 | 0 | 0 | 0 | 0 | 14.554 | 0 | 0.4999 | 0.849 | 0.02 | 0.03 | 0.4617 | 0.4613 |
011 | 0.047 | 0.068 | 0 | 0.001 | 0.035 | 0 | 22.7 | 4.14 | 0.4507 | 6.3776 | 0.05 | 0.06 | 0.4614 | 0.4614 |
012 | 0.1 | 0.042 | 0 | 0.001 | 0 | 0 | 7.768 | 27.1 | 14.085 | 12.0407 | 0.03 | 0.07 | 0.4666 | 0.4622 |
013 | 0.578 | 0.448 | 0 | 0.001 | 0 | 0 | 6.12 | 24.7 | 0.6261 | 4.36 | 0.05 | 0.05 | 0.4604 | 0.4666 |
014 | 0.43 | 0.391 | 0 | 0.002 | 0 | 0 | 25.6 | 5.425 | 6.424 | 15.9744 | 0.06 | 0.06 | 0.4604 | 0.4637 |
015 | 0.318 | 0 | 0 | 0.002 | 0 | 0.032 | 30.7 | 77.4 | 0.5089 | 18.3124 | 0.05 | 0.05 | 0.4636 | 0.4667 |
016 | 0.267 | 0.162 | 0 | 0.001 | 0 | 0 | 6.66 | 5.387 | 13.7095 | 0.5945 | 0.05 | 0.04 | 0.4689 | 0.4659 |
017 | 0.207 | 0.414 | 0.002 | 0.002 | 0.012 | 0 | 59.6 | 10.737 | 0 | 14.971 | 0.05 | 0.04 | 0.4594 | 0.4618 |
018 | 0.259 | 0.11 | 0.003 | 0.002 | 0 | 0 | 38.1 | 4.25 | 8.082 | 23.2766 | 0.05 | 0.01 | 0.4596 | 0.4645 |
019 | 0.477 | 0.733 | 0.003 | 0.002 | 0.033 | 0 | 5.335 | 41.4 | 8.6049 | 0.5757 | 0.06 | 0.01 | 0.46 | 0.4657 |
020 | 0.199 | 0.084 | 0.002 | 0.002 | 0 | 0 | 38.5 | 5.647 | 0.4946 | 0.4999 | 0 | 0.01 | 0.4792 | 0.4638 |
021 | 0.105 | 0.072 | 0.003 | 0 | 0 | 0.041 | 58.6 | 25.3 | 6.3776 | 0.4507 | 0 | 0.01 | 0.4589 | 0.4628 |
022 | 0 | 0.246 | 0.004 | 0.002 | 0.024 | 0.011 | 5.207 | 5.108 | 12.0407 | 14.085 | 0 | 0 | 0.49 | 0.4634 |
023 | 0 | 0.521 | 0.003 | 0.001 | 0.005 | 0.007 | 5.015 | 14.057 | 4.36 | 0.6261 | 0 | 0.03 | 0.4599 | 0.4632 |
024 | 0.069 | 0.058 | 0.003 | 0.002 | 0.028 | 0 | 4.735 | 131 | 15.9744 | 6.424 | 0.05 | 0.01 | 0.4612 | 0.4681 |
025 | 0.114 | 0.259 | 0.002 | 0.003 | 0 | 0 | 43.9 | 5.972 | 18.3124 | 0.5089 | 0.05 | 0.02 | 0.4596 | 0.4564 |
026 | - | 0.477 | 0.003 | - | 0 | - | 36.4 | - | 13.7095 | - | 0.03 | - | 0.0246 | |
027 | - | 0.199 | 0.002 | - | 0 | - | 43 | - | 0 | - | 0.04 | - | 0.4681 | |
028 | - | 0.105 | 0.003 | - | 0 | - | 5.429 | - | 8.082 | - | 0.02 | - | 0.4599 | |
029 | - | 0.1 | 0.004 | - | 0 | - | 5.381 | - | 8.6049 | - | 0.04 | - | 0.4625 | |
030 | - | 0.2 | 0.003 | - | 0.097 | - | 38.5 | - | 0.4946 | - | 0.04 | - | 0.4596 | |
031 | - | 0.069 | 0.004 | - | 0 | - | 58.6 | - | 26.3013 | - | 0.05 | - | 0.4873 | |
032 | - | 0.114 | 0.003 | - | 0 | - | 5.207 | - | 0.589 | - | 0.01 | - | 0.4627 | |
033 | - | 0.075 | 0.005 | - | 0 | - | 5.015 | - | 8.6075 | - | 0.01 | - | 0.4649 | |
034 | - | 0.297 | 0.003 | - | 0 | - | 4.735 | - | 0.0628 | - | 0.02 | - | 0.467 | |
035 | - | 0.332 | 0.003 | - | 0 | - | 43.9 | - | 9.0266 | - | 0.04 | - | 0.4613 |
Variables | Mean | Min. | Max. | S.D. | C.V. |
|---|---|---|---|---|---|
Turbidity (NTU) | 11.64 | 7.52 | 19.69 | 3.27 | 28.09 |
DO | 4.03 | 3.93 | 4.42 | 0.13 | 3.26 |
TSS | 26.17 | 24 | 32.8 | 2.96 | 11.31 |
Ph | 65.64 | 6.2 | 6.8 | 0.21 | 3.20 |
EC | 0.16 | 0.02 | 0.07 | 0.01 | 42.06 |
TDS | 32.52 | 21 | 55 | 9.23 | 28.09 |
Fe | 0.18 | 0 | 0.578 | 0.15 | 87.31 |
Cd | 0.00 | 0 | 0.007 | 0.002 | 62.62 |
Cu | 0.010 | 0 | 0.057 | 0.02 | 152.11 |
Ca | 19.98 | 3.176 | 59.6 | 17.29 | 86.53 |
Ma | 8.281 | 0 | 23.2766 | 6.96 | 84.04 |
Pb | 0.032 | 0 | 0.06 | 0.020 | 61.29 |
Zn | 0.464 | 0.46 | 0.4824 | 0.008 | 1.73 |
Variables | Mean | Min. | Max. | S.D. | C.V. |
|---|---|---|---|---|---|
Turbidity (NTU) | 148,11 | 18.62 | 346.54 | 74.22 | 50.12 |
DO | 14.76 | 4.08 | 345.51 | 58.39 | 387.22 |
TSS | 45.63 | 35 | 61.7 | 8.49 | 18.59 |
Ph | 17.21 | 4.8 | 7.2 | 0.64 | 10.91 |
EC | 0.57 | 0.1 | 0.89 | 0.29 | 49.9 |
TDS | 417.17 | 52 | 968 | 207.33 | 50.12 |
Fe | 0.24 | 0 | 0.733 | 0.18 | 74.41 |
Cd | 0.001 | 0 | 0.005 | 0.001 | 85.70 |
Cu | 0.008 | 0 | 0.097 | 0.02 | 228.07 |
Ca | 23.46 | 0 | 131 | 27.08 | 115.43 |
Ma | 7.116 | 0 | 26.3013 | 7.08 | 99.44 |
Pb | 0.030 | 0 | 0.07 | 0.018 | 57.13 |
Zn | 0.452 | 0.024 | 0.4667 | 0.074 | 16.27 |
Isolates Rate, Number (%) | ||||||||||
|---|---|---|---|---|---|---|---|---|---|---|
Quarter | K. pneumoniae | E. coli | S. typhi | E. aerogenes | Total | |||||
Samples | Su | GW | Su | GW | Su | GW | Su | GW | Su | GW |
Odosi (n=4) | 1 (25) | 1 (25) | 2 (50) | 2 (50) | 1 (25) | 1 (25) | 2 (50) | 2 (50) | 6 (17.14) | 6 (10.71) |
Ukhuoro (n=4) | 1 (10) | 2 (50) | 1 (0) | 2 (50) | 1 (25) | 0 (0) | 0 (0) | 3 (75) | 3 (8.57) | 7 (21.42) |
Ukpafoga (n=4) | 1 (25) | 2 (50) | 2 (50) | 3 (75) | 1 (25) | 1 (25) | 2 (20) | 2 (50) | 6 (17.14) | 8 (14.29) |
Ukhuedeodu (n=4) | 1 (10) | 2 (25) | 1 (0) | 2 (25) | 1 (25) | 0 (0) | 0 (0) | 3 (75) | 3 (8.57) | 7 (21.42) |
Ukpafisi (n=4) | 1 (25) | 0 (0) | 1 (25) | 2 (50) | 1 (25) | 1 (25) | 2 (50) | 0 (0) | 5 (14.20) | 3 (5.36) |
Ukpokunmu (n=6) | 1 (25) | 3 (50) | 3 (75) | 3 (50) | 2 (50) | 2 (33) | 2 (50) | 3 (50) | 8 (22.86) | 11 (19.64) |
Ukpafekhai (n=4) | 1 (25) | 1 (25) | 2 (20) | 2 (50) | 2 (25) | 0 (0) | 2 (50) | 2 (50) | 7 (20.0) | 5 (8.93) |
Ukpafortisi (n=4) | 1 (25) | 1 (25) | 2 (50) | 2 (50) | 0 (0) | 0 (0) | 1 (25) | 2 (50) | 4 (11.43) | 5 (8.93) |
Control (n=2) | 1 (25) | 0 (0) | 0 (0) | 2 (50) | 0 (0) | 1 (25) | 1 (25) | 1 (25) | 2 (5.71) | 4 (7.14) |
Total | 6 (17.14) | 12 (21.43) | 11 (31.43) | 20 (35.71) | 8 (22.86) | 6 (10.71) | 10 (28.57) | 18 (32.14) | 35 (100.0) | 56 (100) |
Sample Location | Number of Bacterial Isolates | Percentages (%) | ||
|---|---|---|---|---|
SU | GW | SU | GW | |
Odosi | 2 | 2 | 7.14 | 7.14 |
Ukhuoro | 2 | 2 | 7.14 | 7.14 |
Ukpafoga | 6 | 3 | 17.14 | 13.42 |
Ukhuedeodu | 4 | 3 | 8.57 | 13.42 |
Ukpafisi | 4 | 3 | 14.29 | 13.42 |
Ukpokunmu | 8 | 8 | 22.86 | 25.64 |
Ukpafekhai | 5 | 2 | 19.0 | 8.93 |
Ukpafortisi | 4 | 2 | 11.43 | 8.93 |
Control | 1 | 1 | 5.71 | 4.14 |
Total | 36-1 | 26-1 | 100 | 100 |
Sample Location | Occurrence Frequency | Percentages (%) | ||
|---|---|---|---|---|
SU | GW | SU | GW | |
K. pneumoniae | 6 | 12 | 17.14 | 21.43 |
E. coli | 11 | 20 | 31.43 | 35.71 |
S. typhi | 8 | 6 | 22.86 | 10.71 |
E. aerogenes | 10 | 18 | 28.57 | 32.14 |
Total | 35 | 56 | 100 | 100 |
Summary | ||||||||
|---|---|---|---|---|---|---|---|---|
Groups | Count | Sum | Average | Variance | ||||
SU | GW | SU | GW | SU | GW | SU | GW | |
K. pneumoniae | 6 | 7 | 6 | 1 | 0. | |||
12 | 1.714286 | 0.571429 | ||||||
11 | 1.833333 | 0.566667 | ||||||
E. coli | 6 | 9 | 20 | 2.222222 | 0.194444 | |||
S. typhi | 6 | 5 | 8 | 6 | 1.333333 | 1.2 | 0.266667 | 0.2 |
10 | ||||||||
E. aerogenes | 6 | 8 | 18 | 1.66667 | 2.25 | 0.26666.7 | 0.5 | |
T | DO | TSS | Ph | EC | TDS | Fe | Cd | Cu | Ca | |
|---|---|---|---|---|---|---|---|---|---|---|
T | 0 | |||||||||
DO | - 0.435** | 0 | ||||||||
TSS | 0.858** | -0.431* | 0 | |||||||
Ph | 0.059 | 0.487** | 0.150 | 0 | ||||||
EC | 0.318 | 0.172 | 0.212 | 0.503** | 0 | |||||
TDS | 0.322 | 0.168 | 0.229 | 0.560** | 0.961* | 0 | ||||
Fe | 0.313 | 0.027 | 0.155 | 0.355 | 0.651** | 0.627** | 0 | |||
Cd | 0.227 | 0.225 | 0.148 | 0.502** | 0.873** | 0.821** | 0.437 | 0 | ||
Cu | 0.239 | 0.214 | 0.124 | 0.504** | 0.973** | 0.936** | 0.625** | 0.972* | 0 | |
Ca | 0.170 | 0.366* | 0.118 | 0.568** | 0.897** | 0.859** | 0.512** | 0.924** | 0.934** | 0 |
Ma | 0.352* | 0.072 | 0.250 | 0.535** | 0.930** | 0.868** | 0.561** | 0.937** | 0.915** | 0.873** |
Pb | 0.324 | -0.028 | 0.265 | 0.453* | 0.819** | 0.823** | 0.789** | 0.719** | 0.764** | 0.632** |
Zn | 0.425* | -0.058 | 0.257 | 0.343* | 0.812** | 0.841** | 0.609** | 0.762** | 0.650** | 0.606** |
K | 0.500** | -0.031 | 0.340 | 0.369** | 0.821** | 0.830** | 0.521** | 0.768** | 0.753** | 0.625** |
E | 0.547 | 0.655 | 0.665 | 0.506* | 0.538** | 0.345** | 0.678** | 0.647** | 0.537** | 0.644** |
S | 0.965 | 0.947* | 0.617 | 0.708* | 0.623** | 0.618** | 0.654** | 0.624** | 0.615** | 0.626** |
E | 0.559 | 0.546 | 0.443 | 0.548 | 0.523* | 0.546 | 0.638** | 0.525** | 0.514** | 0.524** |
Ma | Pb | Zn | K. Pneumo | E. Coli | S. Typhi | E. Aerog | |
|---|---|---|---|---|---|---|---|
T | |||||||
DO | |||||||
TSS | |||||||
Ph | |||||||
EC | |||||||
TDS | |||||||
Fe | |||||||
Cd | |||||||
Cu | |||||||
Ca | |||||||
Ma | 0 | ||||||
Pb | 0.731** | 0 | |||||
Zn | 0.636** | 0.835** | 0 | ||||
K | 0.737** | 0.802** | 0.959** | 0 | |||
E | 0.619** | 0.547** | 0.937** | 0.462** | 0 | ||
S | 0.937** | 0.528** | 0.512** | 0.513** | 0.523** | 0 | |
E | 0.523** | 0.540** | 0.531** | 0.503** | 0.415** | 0.456** | 0 |
T | DO | TSS | Ph | EC | TDS | Fe | Cd | Cu | Ca | |
|---|---|---|---|---|---|---|---|---|---|---|
T | 0 | |||||||||
DO | - 0.455** | 0 | ||||||||
TSS | 0.958** | -0.441* | 0 | |||||||
Ph | 0.060 | 0.487** | 0.151 | 0 | ||||||
EC | 0.320 | 0.182 | 0.214 | 0.603** | 0 | |||||
TDS | 0.325 | 0.171 | 0.233 | 0.580** | 0.961* | 0 | ||||
Fe | 0.316 | 0.037 | 0.158 | 0.375 | 0.661** | 0.687** | 0 | |||
Cd | 0.267 | 0.245 | 0.168 | 0.592** | 0.973** | 0.921** | 0.477 | 0 | ||
Cu | 0.259 | 0.234 | 0.154 | 0.604** | 0.983** | 0.936** | 0.635** | 0.982* | 0 | |
Ca | 0.170 | 0.366* | 0.118 | 0.568** | 0.897** | 0.859** | 0.512** | 0.924** | 0.934** | 0 |
Ma | 0.372* | 0.076 | 0.270 | 0.545** | 0.950** | 0.888** | 0.571** | 0.957** | 0.955** | 0.873** |
Pb | 0.334 | -0.028 | 0.285 | 0.463* | 0.839** | 0.843** | 0.799** | 0.729** | 0.784** | 0.636** |
Zn | 0.455* | -0.058 | 0.277 | 0.363* | 0.832** | 0.847** | 0.609** | 0.752** | 0.750** | 0.626** |
K | 0.505** | -0.034 | 0.360 | 0.389** | 0.841** | 0.860** | 0.524** | 0.778** | 0.759** | 0.655** |
E | 0.567 | 0.675 | 0.765 | 0.566* | 0.638** | 0.345** | 0.678** | 0.657** | 0.567** | 0.674** |
S | 0.965 | 0.987* | 0.657 | 0.768* | 0.723** | 0.658** | 0.674** | 0.644** | 0.645** | 0.656** |
E | 0.589 | 0.566 | 0.453 | 0.578 | 0.543* | 0.566 | 0.668** | 0.545** | 0.534** | 0.544** |
Ma | Pb | Zn | K. Pneumo | E. Coli | S. Typhi | E. Aerog | |
|---|---|---|---|---|---|---|---|
T | |||||||
DO | |||||||
TSS | |||||||
Ph | |||||||
EC | |||||||
TDS | |||||||
Fe | |||||||
Cd | |||||||
Cu | |||||||
Ca | |||||||
Ma | 0 | ||||||
Pb | 0.751** | 0 | |||||
Zn | 0.736** | 0.845** | 0 | ||||
K | 0.757** | 0.802** | 0.979** | 0 | |||
E | 0.639** | 0.567** | 0.967** | 0.467** | 0 | ||
S | 0.997** | 0.568** | 0.532** | 0.523** | 0.533** | 0 | |
E | 0.543** | 0.544** | 0.534** | 0.533** | 0.455** | 0.456** | 0 |
IBM | International Business Machines |
MPN | Most Probable Number |
SPM | Spread Plate Methods |
| [1] | Ayeni, A. O., Balogun, I. I and Soneye, A. S. O. (2011). Seasonal assessment of the physicochemical concentration of the polluted urban river: The case of Ala River in Southwestern Nigeria. Research Journal of Environmental Science. 5(1), 22-35. |
| [2] | Agbebaku, H. U. (2020). Water quality assessment of hand-dug wells in Apapa Local Government Area of Lagos State. Osun Geographical Review, Journal of the Department of Geography, Osun State University, State of Osun, Nigeria, 3, 36-43. |
| [3] | Agbebaku, H. U., Raleigh, D. A and Afolayan, O. S. (2022). Assessment of physicochemical and bacteriological parameters of surface and groundwater in Apapa, Lagos, Nigeria. Ife Research Publications in Geography, 21(1), 139-149, |
| [4] | Akoteyon, I. S and Soladoyin, O. (2011). Groundwater quality assessment in Eti-Osa, Lagos Nigeria using Multivariate Analysis. Journal of Applied Sciences & Environmental Management 15(1), 121-125. |
| [5] | Atafo, I. A. (2023). Granted Interview. Historians and elders spoke to men of the Uhonmora-Ora Community. |
| [6] | American Public Health Association, (APHA, 2015). Standard Methods for the Examination of Water and Wastewater. 18th ed., Washington, DC. |
| [7] | Chapman, D. (1996). Water Quality Assessment; A guide to be the use of biota, sediments and water in environmental monitoring, London, 585. Printed in Great Britain at the University Press, Cambridge ISBN 0 419 21590 5 (HB) 0 419 21600 6 (PB). |
| [8] | Chukwu, M. N and Oranu, C. N. (2018). Performance assessment of biological wastewater treatment at WUPA Wastewater Treatment Plant, Abuja, Nigeria. Nigerian Journal of Environmental Sciences and Technology. 2(1), 46-55. |
| [9] | Edo State Water Board Corporation (ESWBC, 2023). EDPA Building, Sakpoba Rd, Avbiama, Benin City 300104, Edo State. Nigeria. |
| [10] | Majebi, E. C and Agbebaku, H. U. (2023). Assessment of the Socioeconomic Impact of Immigrants on Sustainable Development From 2013-2022 Period in Uhonmora-Ora, Edo State, South-South, Nigeria. International Journal of Migration and Global Studies [IJMGS]. 3(2), 62-86. |
| [11] | National Standard Development Water Quality (NSDWQ, 2018). |
| [12] | National Environmental Standards and Enforcement Agency. NESREA, (2022). About NESREA, Annual Bulletin, Abuja. |
| [13] | National Population Commission, NPC (2023). Edo State, Benin City. |
| [14] | Ohimai, E. A. (2023). Granted interview. Historian and elder man of the Uhonmora-Ora Community. |
| [15] | Omada, J. I., Chukwu, M. N & Agbebaku, H. U. (2024). Assessment of geochemistry of surface and groundwater sources during the wet season in Uhonmora-Ora Owan-West Local Government Area, Edo State, Nigeria. Integral Research (Peer-reviewed, Open Access & Indexed Multidisciplinary Journal), 1(8), 21-40. |
| [16] | Omokpariola, D. O., Nduka, J. K., Kelle, H. I., Mgbemena, N. M. A & Iduseri, E. O. (2022). Chemometric, Health Risk Assessment and Probable Sources of Soluble Total Petroleum Hydrology in Atmospheric Rainwater Rivers State. |
| [17] | Ozebo, V. C and Ajiroba, S. O. (2011). Groundwater assessment in the Apapa coastal line area of Lagos using the Electrical Resistivity Method. 2(4), 23-31. |
| [18] | Rayleigh, D. A., Grace, U O. M and Agbebaku, H. U. (2019). An assessment of physico-chemical properties of drinking water sources in Kashere, Gombe State. Bima Journal of Science and Technology, 3(1). |
| [19] | Soladoye, O and Agbebaku, H. U. (2015). Comparative analysis of groundwater quality under different land-use types in Apapa Local Government Area of Lagos, Nigeria. American Academic & Scholarly Research Journal, 7(3), 01-08, |
| [20] | Strahler, A and Strahler, A. (2006). Introducing physical geography, America, John Wiley and Sons Inc. 4. |
| [21] | World Health Standards of Water Quality (WHSWQ, 2021). |
| [22] | World Health Organization (WHO, 2018). WHO Library Cataloguing-in-Publication Data Guidelines for Drinking-Water Quality - 4th ed. |
| [23] | World Health Organization (WHO, 2018). Water Quality Standards and Methods. The World Health Report: Reducing Risks, Promoting Healthy Life, Geneva. |
| [24] |
World Health Organization (WHO, 2015). Safe Guiding the Environment, WHO, Geneva,
http://www.who.int/quantifying_ehimpacts/publications/saferwater/en/index.html Retrieved November 2020. |
| [25] | World Water Science School, Geological Survey's |
| [26] | Elegbede, I. O., Matti-Sanni, R. O., Moriam O., and Emily Osa, I (2023). Sustainable Education and Environmental Awareness. Encyclopedia of Sustainable Management. 3270-3277. |
| [27] | Agbebaku, H. U. (2015). Environmental challenges and climate change: Nigeria's experience. Journal of research in environmental and earth science 2(4), 01-12. |
APA Style
Usiobaifo, A. H., Enenhizenan, I. S., Etim, N. I., Henrietta, O., Gospe, E. C., et al. (2026). Biological Characteristics and Geochemistry of Surface and Groundwater in Uhonmora-Ora, Owan West Local Government Area, Edo State, Nigeria. American Journal of Environmental Science and Engineering, 10(1), 21-36. https://doi.org/10.11648/j.ajese.20261001.12
ACS Style
Usiobaifo, A. H.; Enenhizenan, I. S.; Etim, N. I.; Henrietta, O.; Gospe, E. C., et al. Biological Characteristics and Geochemistry of Surface and Groundwater in Uhonmora-Ora, Owan West Local Government Area, Edo State, Nigeria. Am. J. Environ. Sci. Eng. 2026, 10(1), 21-36. doi: 10.11648/j.ajese.20261001.12
AMA Style
Usiobaifo AH, Enenhizenan IS, Etim NI, Henrietta O, Gospe EC, et al. Biological Characteristics and Geochemistry of Surface and Groundwater in Uhonmora-Ora, Owan West Local Government Area, Edo State, Nigeria. Am J Environ Sci Eng. 2026;10(1):21-36. doi: 10.11648/j.ajese.20261001.12
@article{10.11648/j.ajese.20261001.12,
  author = {Agbebaku Henry Usiobaifo and Imanfidon Samson Enenhizenan and Ndekhedehe Imie Etim and Obueh Henrietta and Ehiogu Chinkata Gospe and Mansur Yusuf Aboki and Zakariya Hassan Abuja},
  title = {Biological Characteristics and Geochemistry of Surface and Groundwater in Uhonmora-Ora, Owan West Local Government Area, Edo State, Nigeria},
  journal = {American Journal of Environmental Science and Engineering},
  volume = {10},
  number = {1},
  pages = {21-36},
  doi = {10.11648/j.ajese.20261001.12},
  url = {https://doi.org/10.11648/j.ajese.20261001.12},
  eprint = {https://article.sciencepublishinggroup.com/pdf/10.11648.j.ajese.20261001.12},
  abstract = {Physicochemical and biological characteristics of surface and groundwater in Uhonmora-Ora were undertaken. Physicochemical parameters examined include pH, turbidity, dissolved oxygen, total dissolved solids, total suspended solids, and electrical conductivity. The heavy metals studied were Iron, Cadmium, Calcium, Copper, Magnesium, Lead, and Zinc. The bacteriological parameters were counts for pneumoniae, coli, typhi, and aerogenes. The study objective assessed the chemical and biological characteristics of surface and groundwater in Uhonmora-Ora and ascertained its suitability. Data from sixty surface and groundwater samples from streams/rivers and hand-dug wells were analyzed. Primary data from 30 water samples of “A” surface and “B” groundwater samples from hand-dug wells were obtained and analysed from the field of study. The technique of study was purely experimental. The study was conducted during the dry season and water samples collections from the 2 sources were analysed in the laboratory to ascertain their state of water quality of physicochemical parameters and biological counts in comparison with the recommended standards of WHO (2015) and NSDWQ (2007), in line with the Nigeria Ministry of Environment standards (2018), on water quality for drinking desire uses. Results showed that a combination of very high and positive correlations exists between and among the tested parameters. However, variations exist within and among the mean concentrations of NTU, DO, TSS, TDS, Fe, Cd, Cu, Ca, Mg, Pb, Zn, K, E, S, and Ea parameters in surface and groundwater sources. The study recommends that at regular intervals, samples from these water sources should be assessed against water quality standards.},
 year = {2026}
}
TY  - JOUR
T1  - Biological Characteristics and Geochemistry of Surface and Groundwater in Uhonmora-Ora, Owan West Local Government Area, Edo State, Nigeria
AU  - Agbebaku Henry Usiobaifo
AU  - Imanfidon Samson Enenhizenan
AU  - Ndekhedehe Imie Etim
AU  - Obueh Henrietta
AU  - Ehiogu Chinkata Gospe
AU  - Mansur Yusuf Aboki
AU  - Zakariya Hassan Abuja
Y1  - 2026/03/04
PY  - 2026
N1  - https://doi.org/10.11648/j.ajese.20261001.12
DO  - 10.11648/j.ajese.20261001.12
T2  - American Journal of Environmental Science and Engineering
JF  - American Journal of Environmental Science and Engineering
JO  - American Journal of Environmental Science and Engineering
SP  - 21
EP  - 36
PB  - Science Publishing Group
SN  - 2578-7993
UR  - https://doi.org/10.11648/j.ajese.20261001.12
AB  - Physicochemical and biological characteristics of surface and groundwater in Uhonmora-Ora were undertaken. Physicochemical parameters examined include pH, turbidity, dissolved oxygen, total dissolved solids, total suspended solids, and electrical conductivity. The heavy metals studied were Iron, Cadmium, Calcium, Copper, Magnesium, Lead, and Zinc. The bacteriological parameters were counts for pneumoniae, coli, typhi, and aerogenes. The study objective assessed the chemical and biological characteristics of surface and groundwater in Uhonmora-Ora and ascertained its suitability. Data from sixty surface and groundwater samples from streams/rivers and hand-dug wells were analyzed. Primary data from 30 water samples of “A” surface and “B” groundwater samples from hand-dug wells were obtained and analysed from the field of study. The technique of study was purely experimental. The study was conducted during the dry season and water samples collections from the 2 sources were analysed in the laboratory to ascertain their state of water quality of physicochemical parameters and biological counts in comparison with the recommended standards of WHO (2015) and NSDWQ (2007), in line with the Nigeria Ministry of Environment standards (2018), on water quality for drinking desire uses. Results showed that a combination of very high and positive correlations exists between and among the tested parameters. However, variations exist within and among the mean concentrations of NTU, DO, TSS, TDS, Fe, Cd, Cu, Ca, Mg, Pb, Zn, K, E, S, and Ea parameters in surface and groundwater sources. The study recommends that at regular intervals, samples from these water sources should be assessed against water quality standards.
VL  - 10
IS  - 1
ER  -
Department of Environmental Science, National Open University of Nigeria, Abuja, Nigeria
Department of Biological Sciences, Wellspring University, Benin City, Nigeria
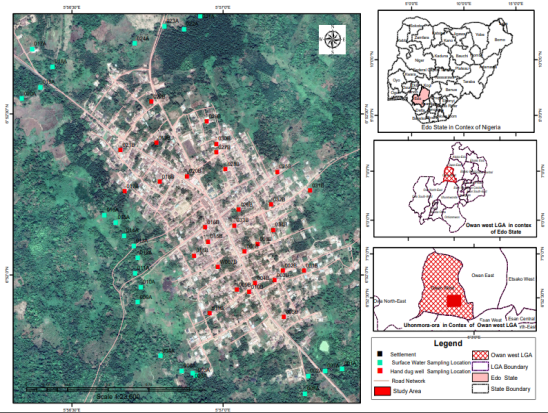
Figure 1. Sampling Location Imagery of Uhonmora - Ora.
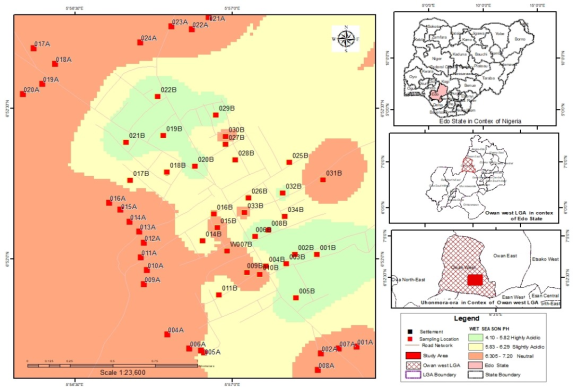
Figure 2. Plot of pH of Water Readings along with Sample Numbers from Uhonmora - Ora. Source: GIS and Cartography Unit, LASU (2024).
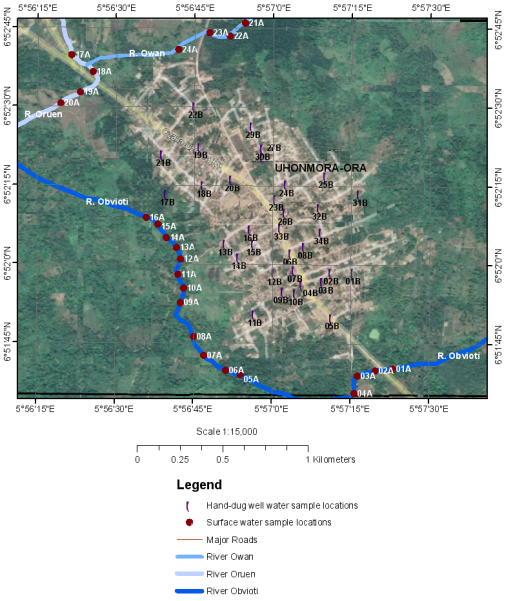
Figure 3. Sampling Location Imagery of the Rivers in Uhonmora-Ora,
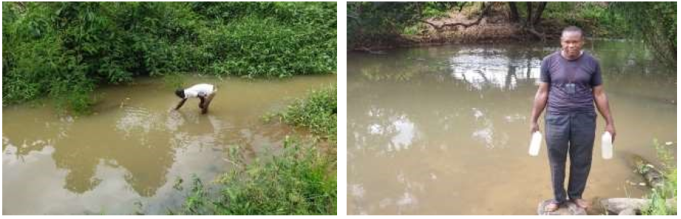
Figure 4. Sampling of Surface Water in the Study Area.
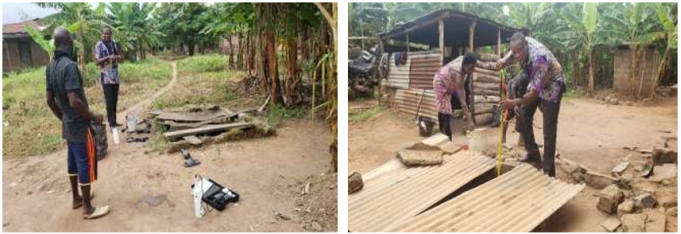
Figure 5. Sampling of Groundwater in the Study Area.